Investigate a failed, blocked, or expensive request
Trace one request from its row in Observability to the decision card, its savings receipt and a Playground reproduction, then read what its error message means.
On this page
The path
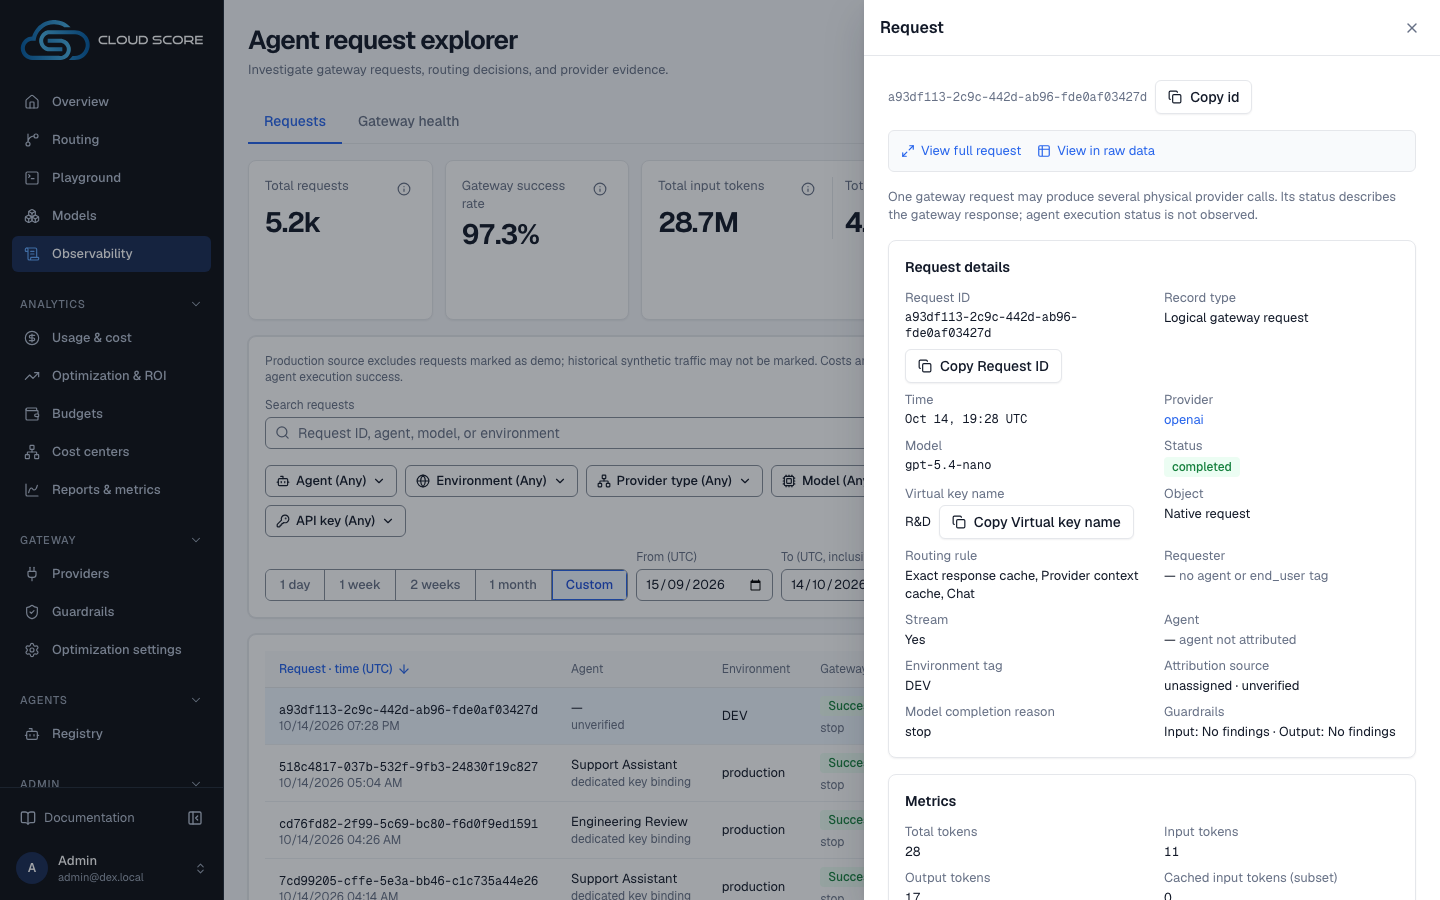
Start with a request ID or UTC incident window. Observability › Requests supplies the audit trail; its Request drawer and the full request page share the same recorded request evidence. A View in raw data link opens Signals scoped to that request.
Use the recorded status, route stages, attempts and cost before deciding how to change a key, model, policy or prompt. Missing evidence carries its cause instead of an inferred zero.
Find it in Observability
Open Observability, select the UTC range, then search by request ID, agent, model or environment, or narrow with Provider type, Model, Object, Requester, Status or API key. Failed requests and Most expensive are one-click shortcuts. The server sorts the time, token, list cost and provider latency headers and pages the result; Total and Displayed describe that result.
Open the request's row.
The
Requestdrawer shows loading until evidence arrives. Its UUID can be copied withCopy id. A trace=<uuid> URL opens the same record directly.Read
Request details,MetricsandAttempts.Confirm the key, provider, selected model and status. A failed request can have no provider call, an earlier successful selection or several billed attempts; inspect each recorded fact independently.
Open
View full requestif you need a dedicated page.Close when finished.
Focus returns to the opener; direct deep links fall back to the table. Back and Forward retain the surrounding view.
Read the decision
Pipeline stations and guardrail verdicts shows recorded stages and their timing. A failed Attempt says failed and sits below the rail. Candidates and recorded decision shows the operative selection, candidate ladder, exclusions and mechanism modes. A final error is displayed separately from an earlier selection.
Quality tiers, affinity, axes and confidence can be unrecorded. Genuine zero measurements remain zero; unknown values state their cause. A selected candidate is not proof that a provider completed the request.
The ledger projects server amounts without recomputing savings. Negative amounts keep their sign. Read Classification and the key's Guardrails profile when routing or security evidence explains the result.
Read the recorded cost
Cost separates recorded list price, provider billable cost, estimate and overhead. Optimization and Cache show their own recorded evidence. Prompt Optimization distinguishes the requested choice from the prompt actually dispatched, and a cache or dedup response can involve no provider send.
On the full request page, the Overview tab ends with the Savings receipt, labelled Estimate: the reference model and its source, reference and actual cost, the routing, response cache and compression savings, known Cloud Score overhead and net savings, then the price card and whether the request was re-priced on reconcile. With no recorded reference model it claims no savings; View cost details opens the Cost & savings tab.
Reference-model savings, same-model prompt avoidance and provider cache-read discounts have different bases. Do not add them without a compatible server total. Cost increase (est.) is a negative saving; it remains visible in error ink. Unrecorded cache savings or token avoidance are unavailable, never fabricated zero.
The same request evidence in the drawer and the page
The Request drawer and the full request page share the same evidence composition. The drawer additionally loads its GitHub correlation: with more than 20 linked pull requests it shows the first 20 and a link to all of them in Signals. Supported external pull-request links open GitHub in a new tab.
Reproduce it in the Playground
Recover the prompt from stored previews or your application.
Request and response previews can be unavailable because storage is off, input was blocked by AI Security or documents were involved. The preview is a stored excerpt, not proof that a complete body is retained.
Open Playground with the same platform key and constraints.
Write
Message, include the system prompt when appropriate, and useRoutingandAdvanced options. The key's profile controls guardrails. Document bytes stay in page memory and must be selected again after leaving.Review optimization before sending.
Wait for known settings. With
Prompt Optimizationon,Optimize promptprepares a comparison; chooseRun originalorRun optimizedonly after reviewing it. Off sends the original. An expired or changed comparison needs a new preparation.Inspect
ResultandDetails.Read Routing, Decision and Usage for recorded evidence. A disconnected stream can be checked with
Check request statuswithout repeating generation. UseCopy IDinDetails›Usagewhen reporting the accepted request; match its time and key in Observability.
Every generation is real
Sending a Playground request is billed and recorded like any other. Stop disconnects the browser stream; it does not cancel server execution or provider billing. Use the accepted request status for the final record.
What the error means
| Recorded error or outcome | What to inspect |
|---|---|
| No enabled model matches capabilities or context | Models and Required capabilities; confirm an enabled model can satisfy the original request. |
| No candidates remain after constraints, policies or failover | Candidate exclusions, Max cost (USD), allow/deny policies and the final selection error. |
| Blocked by policy or budget | The named policy or budget. A blocked request may never reach a provider. |
| Blocked or redacted by AI Security | Input/output guardrail verdicts and the selected key’s profile; detector labels retain their canonical names. |
| Provider error / deadline exhausted / validation retry | Each attempt and its provider error; repeated failure does not imply that no earlier selection occurred. |
| Missing or invalid API key | The enabled platform key, its scope and header; a provider credential is not a platform key. |
| Stream closed before completion | Check request status or the Observability record. Do not infer cancellation or repeat the generation automatically. |
| Trace not found | The ID and current workspace. The drawer closes with a notice and no event-dependent actions. |
Server error text is rendered as text. Keep the displayed request ID when reporting a failure; do not share credentials or prompt contents unnecessarily. Troubleshooting describes setup failures.
What to check afterwards
Check the incident period again in Observability.
Use the same filters and UTC range, inspect completed/failed/blocked totals and refresh recorded evidence. Empty, filtered and past-last-page messages have separate actions. For latency or failure rates by the hour, open Gateway health.
Compare recorded cost and latency on their stated bases.
A smaller prompt alone proves neither lower total cost nor a faster end-to-end request. Use exact values and available coverage; retain unknown causes.
Share the scoped request or Signals link.
The URL restores the relevant view and request. Normal account and workspace verification still applies.
Related
- TroubleshootingThe messages Cloud Score puts in front of you, grouped by the page that shows them, with what caused each one and what to do next.
- Statuses and badgesEvery status word and badge Cloud Score shows, what each one means, and the page it appears on.
- GlossaryEvery Cloud Score term that appears in the app, what it means in one or two sentences, and the page and tab where you meet it.
- Roll out an optimization safelyPromote one optimization mechanism from observe to auto without surprising your callers: read the would-apply counts, set a confidence floor, confirm the promotion, verify it per request in Observability, read the savings on Optimizations, and roll back in one save.
- ObservabilityThe per-request audit trail and the gateway's health: filter the request list, open a request for its route, attempts, cost and savings receipt, and read latency, outcomes and retries on Gateway health.
- Usage & costWhere tokens and money go, by team, user, agent, model, provider, key and prompt size: five scope tiles, usage over time, token composition, share of requests against share of spend, and one breakdown table with a drawer per row.