Gateway health and where Analytics went
Gateway health shows latency, request outcomes, retries, fallbacks and the routing strategy mix on an hourly-capable range. This page also maps each former Analytics view to its new home, and covers ROI configuration and saved reports.
On this page
Gateway health
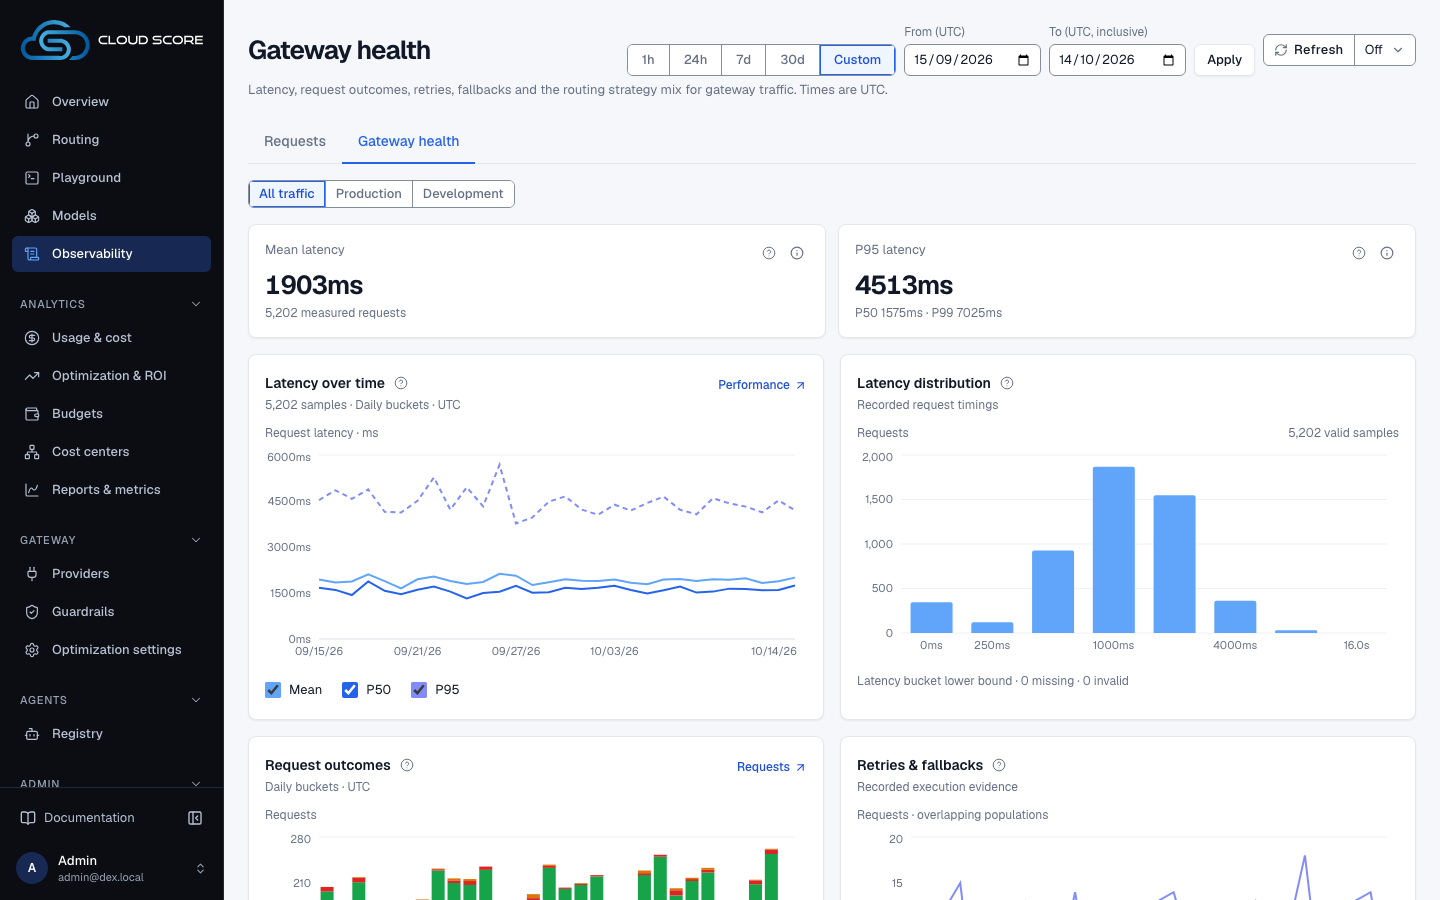
Gateway health is the second tab of Observability, beside Requests, at /logs/health. It is the operator view: how fast and how reliably the gateway served requests. Its business figures, such as spend and savings, live on Overview, Usage & cost and Optimizations.
| Section | What it shows |
|---|---|
Mean latency / P95 latency | Mean recorded end-to-end request latency with the number of measured requests, and the exact P95 over individual observations, with P50 and P99 beneath it. |
Latency over time | Mean, P50 and P95 per UTC bucket. Missing observations are gaps, never zero. |
Latency distribution | Recorded request timings in buckets that include their lower bound; the last bucket is unbounded. Missing and invalid timings are reported separately. |
Request outcomes | Completed, Failed, Blocked and Other requests per bucket. Together they partition the selected requests. |
Retries & fallbacks | Recorded retries and recovered fallbacks per bucket. The populations can overlap; requests without usable retry evidence are counted separately. |
Routing strategy mix | Requests by the strategy recorded in their traces. Quality is the display label for the intelligence strategy; missing strategy evidence is unattributed, and Auto is never inferred. |
Performance and Requests links on the latency and outcome charts open an evidence sheet with the exact values for the captured range. For one request at a time, open Requests.
Range, source and refresh
Unlike Usage & cost and the Optimizations Overview, Gateway health works by the hour. Choose 1h, 24h, 7d (the default) or 30d, or a custom UTC range. 1h and 24h are rolling windows anchored to the current minute; ranges up to two days use hourly buckets and longer ranges daily ones.
Choose the traffic source: All traffic (the default), Production or Development. Refresh now or pick an interval; automatic refresh pauses while the browser tab is hidden, and a rolling window moves forward with each refresh. The address keeps the range, the source and the interval, and older links to the former performance view open here with their range.
Where each former view went
The former Analytics page and its views were folded into the pages below. Old links redirect. On Usage & cost, filters the page cannot apply appear in its Ignored filters notice; Optimizations, Gateway health and Requests show no such notice.
| Former view | Now |
|---|---|
Overview, Tokens, Cache, Routing | Optimizations › Overview: the tiles, Savings breakdown, Breakdown and the Optimization engine (By mechanism, Savings waterfall). |
Prompt Optimization | Optimizations › Prompt Optimization. |
Performance | Gateway health, above. |
Requests | Observability › Requests. |
Levels | Usage & cost, breakdown by team. |
ROI configuration and reports
ROI & Impact is under Analytics in the sidebar and opens on ROI & Impact Analysis › Overview: the system dashboards (AI spend overview, Engineering impact, Adoption, Cost per pull request), your custom dashboards and Return on investment. Its other tabs are Reports, Metrics, Schedules and Signals. Its Configuration stores the monthly platform fee, setup cost, amortization months and UTC investment start date. The server prorates these costs for the ROI period; ROI is net reference savings divided by the applicable fee, and a missing or zero fee leaves ROI unavailable. Monthly and annual savings are projections of the observed period, assuming the same request rate, mix and prices continue.
In Reports, add a report: a saved set of metrics with an audience, a computation cadence and optional written commentary. Opening one shows each metric's value, type, sample size and threshold status. Below the saved reports, Standard exports builds Cost optimization, Token optimization, Cache performance, Model routing, Latency & performance, API key usage or ROI / business impact over production traffic in a chosen range: an executive summary with supporting evidence, downloadable as CSV or JSON, or printed.
Measurement limits
Cached and uncached requests are separate cohorts, so their latency difference is not claimed as time saved; the evidence sheet reads Paired latency improvement Not measured. Quality improvement also needs explicit evaluation.
Percentiles are computed over individual observations in the period, never averaged from bucket percentiles. Recorded retries count requests with a trace-evidenced repeated provider call after a transient failure; untraced transport retries are unavailable rather than zero.
Related
- ObservabilityThe per-request audit trail and the gateway's health: filter the request list, open a request for its route, attempts, cost and savings receipt, and read latency, outcomes and retries on Gateway health.
- OptimizationsRead what the optimization engine applied and what it saved against the reference model, on the Optimizations and Prompt Optimization pages in Analytics.
- Usage & costWhere tokens and money go, by team, user, agent, model, provider, key and prompt size: five scope tiles, usage over time, token composition, share of requests against share of spend, and one breakdown table with a drawer per row.
- Home dashboardsA recorded view of request outcomes, estimated cost avoided, routing, optimization, policy attribution, and operational health for the traffic you select.
- PlaygroundCompare original and optimized prompts, choose which version to route, then inspect the answer and recorded execution evidence.
- Costs, savings, and estimatesWhat AI spend, the estimated invoice, Cloud Score overhead, and the pre-flight estimate each measure, and how one savings ledger reads the same on every page.