Observability
The per-request audit trail and the gateway's health: filter the request list, open a request for its route, attempts, cost and savings receipt, and read latency, outcomes and retries on Gateway health.
On this page
Prompt Optimization: optimize, review, then run
Prompt Optimization has one ON/OFF control, defaults ON, and accepts any prompt length. In Playground, Optimize prompt prepares a complete optimized prompt before answer routing, at the level you pick — Standard, Balanced or Thorough. Live counts use a real backend tokenizer. Review the original, optimized version and diff, then choose Run original or Run optimized. Our checks cannot guarantee that meaning is preserved, which is why you review the result. Editing the request invalidates its comparison. Workspace defaults are under Optimization › Settings.
Playground explicitly requests a bounded optimization and shows its recorded cost. A rejected, unavailable or unhelpful result falls back to your original without hiding its expense. Requests sent ON without a prepared proposal are optimized by structural rules only. Comparison details show the outcome, the rules applied and the measured work time. Infrastructure still consumes resources; unallocated compute keeps fully loaded savings unknown. Historical optimization expenses remain recorded and are not reset to zero.
The execution receipt distinguishes the selected prompt from the prompt actually sent for the answer, including no provider send when a cache supplies it. Optimization can have a recorded cost even when the original is selected or no answer is generated. Unknown infrastructure cost keeps fully loaded net unknown. Fewer tokens do not establish a latency or quality improvement. Analytics, ROI and Reports reuse Prompt Optimization evidence with production/demo filters and daily, weekly and monthly views.
See Playground for comparison and recovery, and Analytics for measurement coverage. Historical compression receipts do not establish choices or costs that were never recorded.
What you see
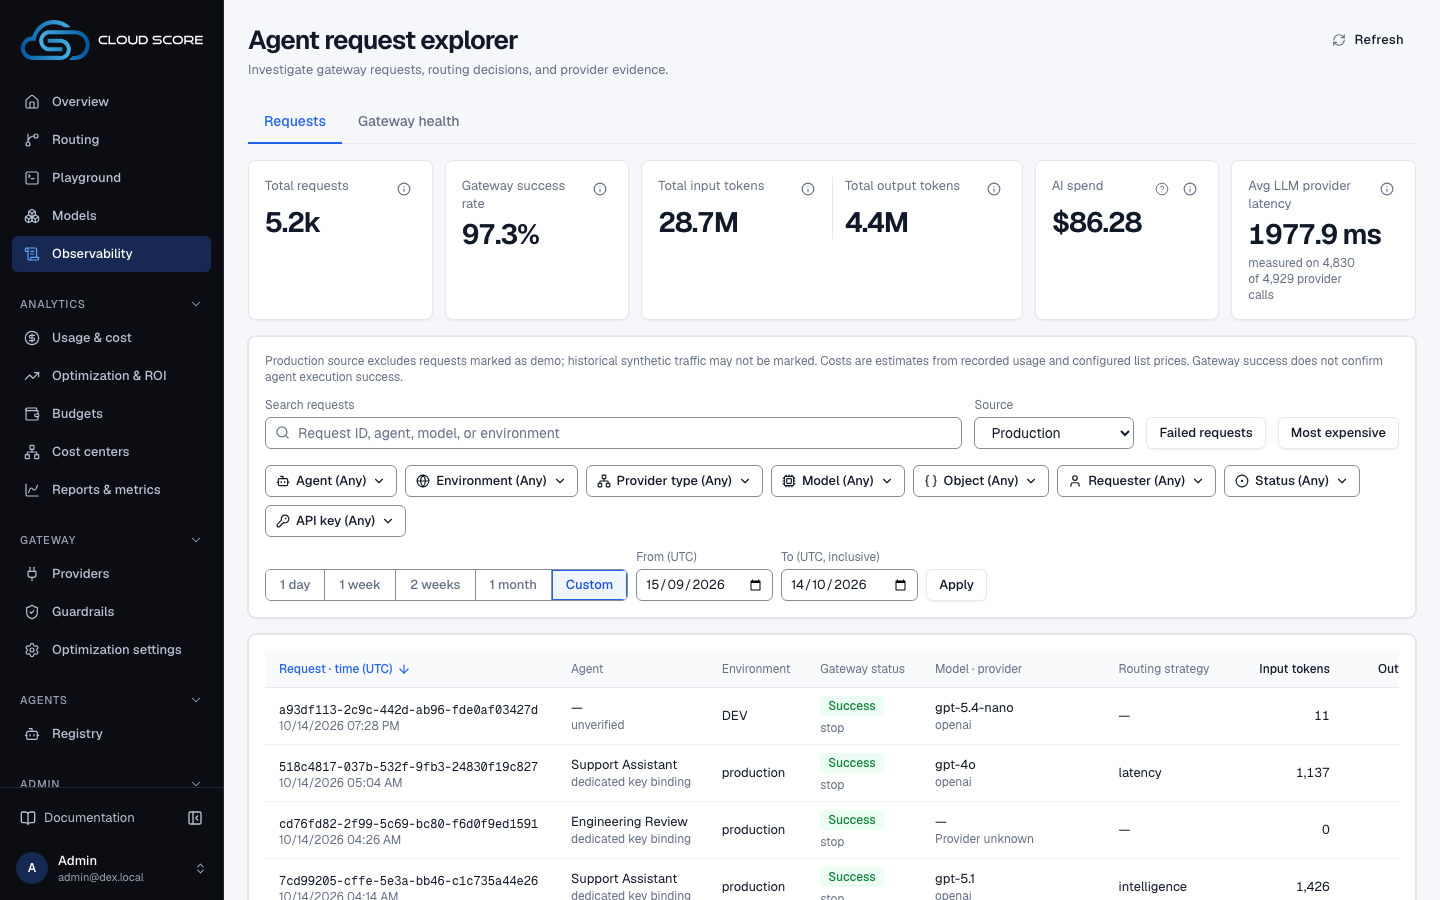
Observability is under Analytics in the sidebar and has two tabs: Requests, the per-request audit trail titled Agent request explorer, and Gateway health. On Requests, five KPI tiles show Total requests, Gateway success rate, total input and output tokens, AI spend and Avg LLM provider latency. AI spend is list price, as on the analytics pages. Use a tile's Exact value control to read its full value.
The table, 50 rows a page, shows Request · time (UTC), Agent, Environment, Gateway status, Model · provider, Routing strategy, Input tokens, Output tokens, List cost estimate, Provider latency, Retry / fallback evidence and Error. Wide tables scroll within their labelled region; keyboard users can focus that region and scroll horizontally.
Open a row for the Request drawer. It shows the request id with Copy id, View full request and View in raw data, then the recorded evidence below.
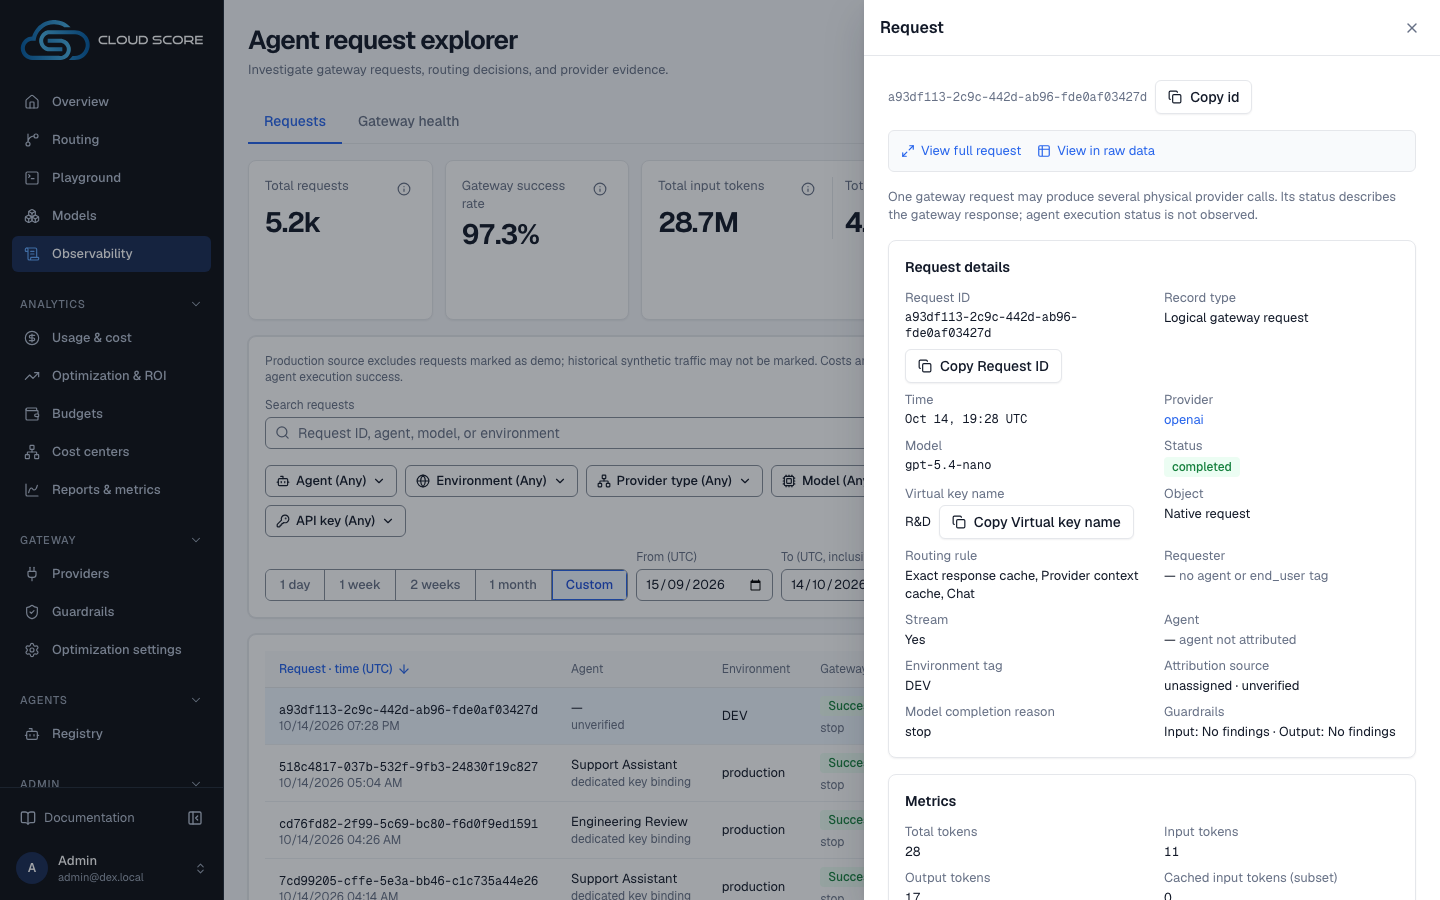
| Section | Evidence |
|---|---|
| Request details | Time, provider, model, status, key, object, requester, stream and matched routing rules. Missing fields state their cause. |
| Metrics / Cost / Platform API overhead | Recorded usage, latency and server-computed Decimal amounts. List cost, provider billable cost and platform overhead remain separate. |
| Pipeline stations and guardrail verdicts | Recorded gateway stages. Failed attempts retain the word failed as well as their lowered rail position. |
| Candidates and recorded decision | The operative selection, candidate evidence and any separate final failover error. A later error does not erase an earlier selection. |
| Optimization / Cache | Actual dispatched prompt receipt or historical compression evidence, plus recorded cache outcome. An unrecorded saving is unavailable, never an assumed zero. |
| Classification / Request and response previews / Attempts | Available gateway detail. Body storage, document processing and security can make previews unavailable. |
| Pull requests | Existing GitHub correlation evidence; if more than 20 are linked, the first 20 are shown with a link to all of them in Signals. |
What you can do
| Action | Behavior |
|---|---|
| Search | Matches a request ID, agent, model or environment. |
Failed requests / Most expensive | Shortcuts that filter to failed requests, or sort by list cost estimate, highest first. |
| Agent / Environment / Provider type / Model / Object / Requester / Status / API key | Select several values in each filter chip. Provider type filters a provider type; the table shows the provider instance. Team, User and Model family chips appear when a link from an analytics page sets them. Filter changes reset to page 1 and replace the URL. |
Source | Production excludes requests marked as demo; All sources includes them. |
| UTC range | Choose 1 day, 1 week, 2 weeks or 1 month (the default), or custom days ending today. A range longer than 366 days is rejected visibly and no affected data request runs. |
| Sortable header | Time, input and output tokens, list cost estimate and provider latency are sorted by the server. A new key starts descending and resets to page 1. |
| Numbered page | Loads the selected server page. Total and Displayed report the filtered result and displayed rows; page=N remains shareable. |
| A row | Pushes trace=<uuid> into the URL and opens the Request drawer. Back and Forward restore the drawer and filter state. |
View full request | Opens the request page with its Overview, Execution, Cost & savings and Details tabs. |
| Refresh / Retry | Refreshes list, totals and the open request. A failed refresh keeps loaded evidence with a notice and actual Retry. |
Step-by-step
Open
Observabilityand choose the incident's UTC period.Choose
failedorblockedinStatus, and narrow with the other chips.Open the matching row.
Read the recorded status, error and
Attempts. The pipeline and candidate section explain what was selected and where execution stopped.Use
View full requestfor a dedicated page, orView in raw datafor scoped Signals evidence.Close the drawer.
Focus returns to the row that opened it. A directly loaded request link closes to the named table region.
Savings receipt
The request page's Overview tab ends with the Savings receipt, labelled Estimate: how this one request's savings were measured. It lists the Reference model and its source, Reference cost, Actual cost (list price), the per-mechanism savings Routing, Response cache and Compression, Gross savings, − Cloud Score overhead (known) and = Net savings, then the Price card and Re-priced on reconcile. Its footer names the basis and the definitions version, with View cost details.
When no reference model was recorded, the receipt says no savings are claimed; while the cost is not settled, it says savings appear once the request is priced. A negative amount keeps its minus sign, and an unknown amount reads — with its cause, never $0.
Gateway health
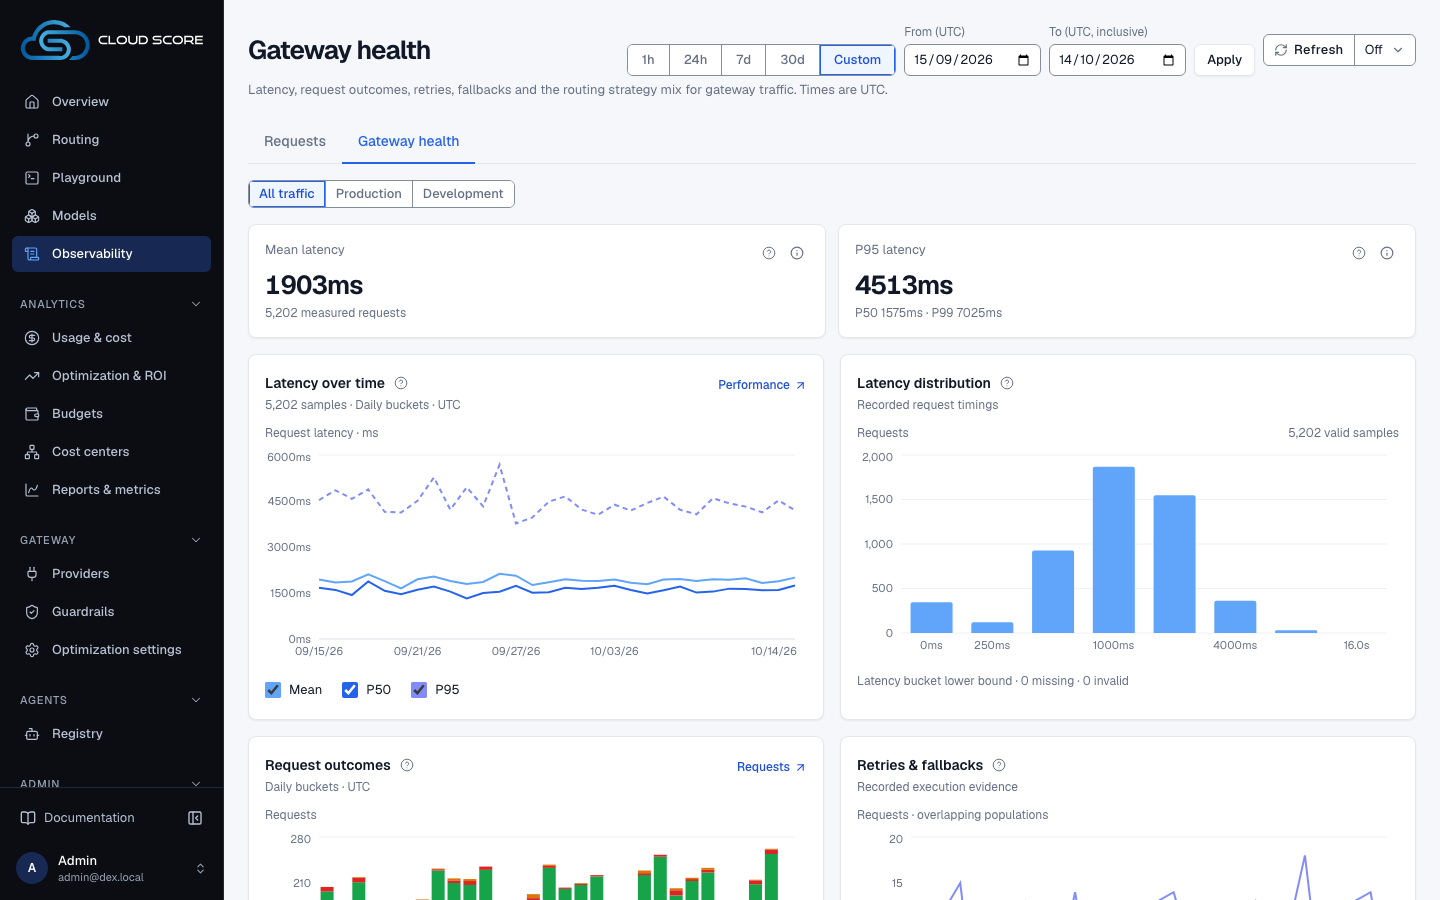
Gateway health, the second tab at /logs/health, is the operator view of the gateway: Mean latency and P95 latency, Latency over time, Latency distribution, Request outcomes, Retries & fallbacks and the Routing strategy mix, with evidence sheets for exact values. It keeps its own hourly-capable range: 1h, 24h, 7d (the default), 30d or custom, with hourly buckets up to two days. See Gateway health for every section.
Reading the numbers
| Measurement | Meaning |
|---|---|
| AI spend | Tokens at published model prices before provider cache-read discounts, for the filtered period. The full server Decimal is behind the tile's Exact value control. |
| List cost estimate | The same list-price basis for one request. The full server Decimal is reachable from the cell's help control. |
| Provider latency | Measured provider time, with the gateway's own latency beneath it. Missing causes distinguish cached or deduplicated responses, blocked or failed requests that made no provider call, and calls with no recorded timing. |
| Prompt comparison / provider usage | Message-text comparison counts and actual provider usage are separate. Historical compression receipts retain their original prompt-basis measurements. |
| Savings (est.) | Server-computed estimates. Negative values remain visible in error ink with a true minus; missing measurements state why they are unavailable. |
Good to know
A request link preserves your view
Range, filters, sort, page and the open request are shareable URL state. A malformed ID is ignored; a missing or inaccessible request closes with a visible message. If you are not signed in, normal account verification applies.
No traffic, an empty period, filtered results and a page beyond the end have distinct messages and relevant actions. Missing records do not create synthetic usage. Gateway success does not confirm agent execution success. See Investigate a request for the cross-screen workflow.
Related
- Investigate a failed, blocked, or expensive requestTrace one request from its row in Observability to the decision card, its savings receipt and a Playground reproduction, then read what its error message means.
- Gateway health and where Analytics wentGateway health shows latency, request outcomes, retries, fallbacks and the routing strategy mix on an hourly-capable range. This page also maps each former Analytics view to its new home, and covers ROI configuration and saved reports.
- Protect sensitive data in prompts and answersBuild an AI Security profile that redacts card numbers and blocks a confidential codename, attach it to a key, prove it in the Playground, and audit every verdict in Logs.
- Statuses and badgesEvery status word and badge Cloud Score shows, what each one means, and the page it appears on.
- TroubleshootingThe messages Cloud Score puts in front of you, grouped by the page that shows them, with what caused each one and what to do next.
- Home dashboardsA recorded view of request outcomes, estimated cost avoided, routing, optimization, policy attribution, and operational health for the traffic you select.