Optimizations
Read what the optimization engine applied and what it saved against the reference model, on the Optimizations and Prompt Optimization pages in Analytics.
On this page
Prompt Optimization: optimize, review, then run
Prompt Optimization has one ON/OFF control, defaults ON, and accepts any prompt length. In Playground, Optimize prompt prepares a complete optimized prompt before answer routing, at the level you pick — Standard, Balanced or Thorough. Live counts use a real backend tokenizer. Review the original, optimized version and diff, then choose Run original or Run optimized. Our checks cannot guarantee that meaning is preserved, which is why you review the result. Editing the request invalidates its comparison. Workspace defaults are under Optimization › Settings.
Playground explicitly requests a bounded optimization and shows its recorded cost. A rejected, unavailable or unhelpful result falls back to your original without hiding its expense. Requests sent ON without a prepared proposal are optimized by structural rules only. Comparison details show the outcome, the rules applied and the measured work time. Infrastructure still consumes resources; unallocated compute keeps fully loaded savings unknown. Historical optimization expenses remain recorded and are not reset to zero.
The execution receipt distinguishes the selected prompt from the prompt actually sent for the answer, including no provider send when a cache supplies it. Optimization can have a recorded cost even when the original is selected or no answer is generated. Unknown infrastructure cost keeps fully loaded net unknown. Fewer tokens do not establish a latency or quality improvement. Analytics, ROI and Reports reuse Prompt Optimization evidence with production/demo filters and daily, weekly and monthly views.
See Playground for comparison and recovery, and Analytics for measurement coverage. Historical compression receipts do not establish choices or costs that were never recorded.
What you see
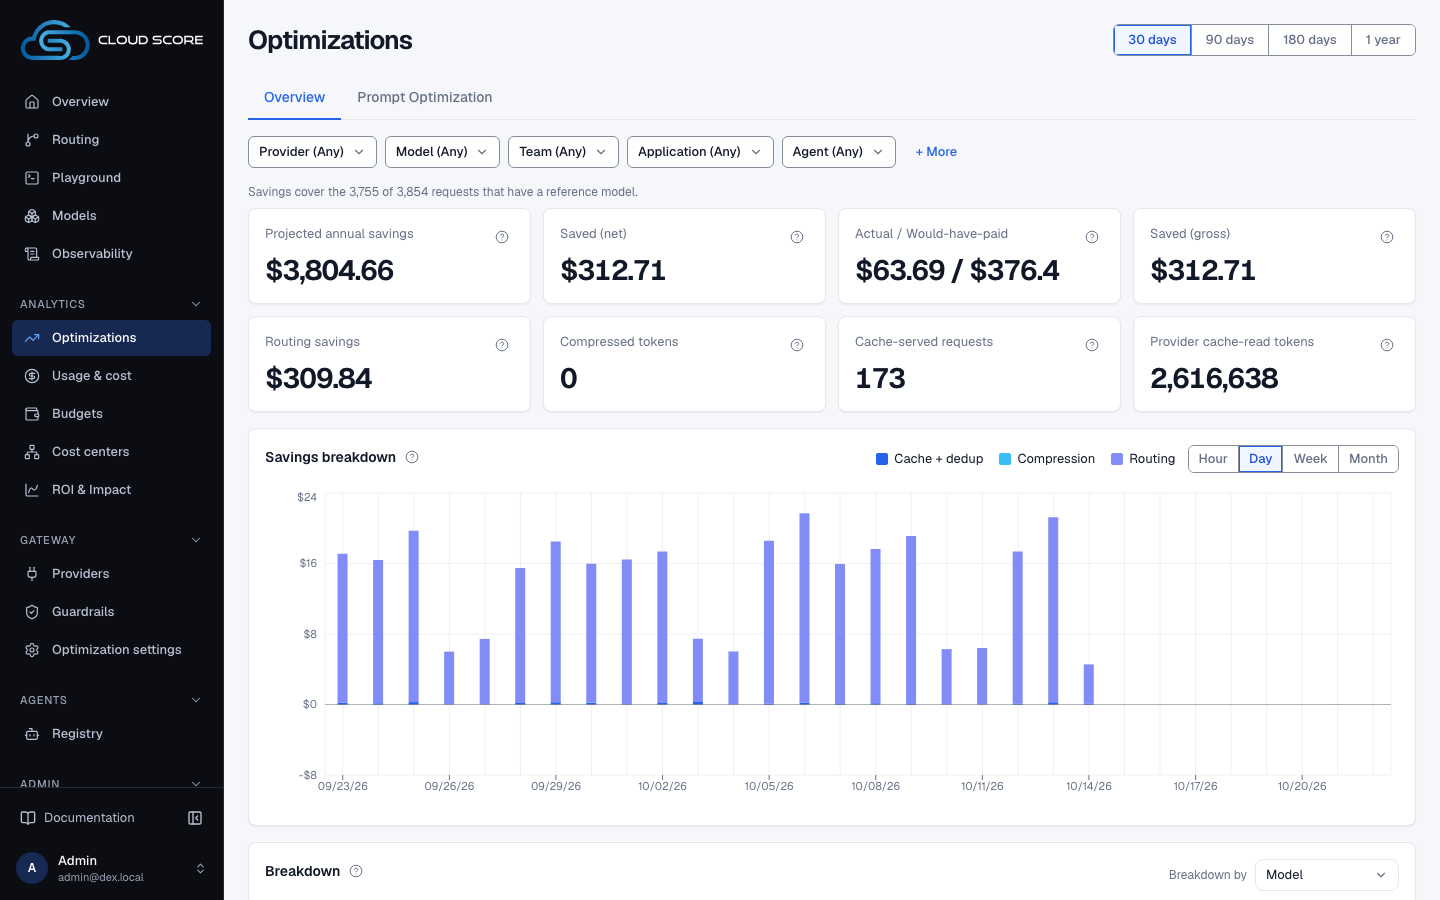
Optimizations is under Analytics in the sidebar and opens the overview directly. Prompt Optimization is a separate page beside Observability in the Analytics navigation. Routing signals, the response cache and the optimization settings are on Optimization settings. Every savings figure is computed on the server; the page never adds two money strings itself.
| Region | What it shows |
|---|---|
| Header | The Analytics navigation identifies the page. On Optimizations, the range switch 30 days 90 days 180 days 1 year (default 30 days), in whole UTC days ending today. On Prompt Optimization, the range buttons 24h 7d 30d 90d Custom; Custom reveals two date inputs, preset to 29 days ago and today (UTC days). |
| Page navigation | Optimizations opens the overview at /optimization; Prompt Optimization opens /prompt-optimization. Old /optimization?tab=prompt links redirect there with their range and filters. ?tab=signals, ?tab=cache and ?tab=settings on Optimizations still open Optimization settings; any other tab value shows the overview. |
| Filter bar (Overview only) | Chips Provider, Model, Team, Application and Agent, whose options come from the traffic in range. + More adds API key, Task, Environment, End user, Status (completed, failed, blocked), Cost status (computed, estimated, pending, reconciled) and Endpoint; a chip that is set always shows. Clear filters appears once any filter is set. |
| Eight tiles | Projected annual savings, Saved (net), Actual / Would-have-paid, Saved (gross), Routing savings, Compressed tokens, Cache-served requests and Provider cache-read tokens. Money tiles count only requests with a reference model; when some requests lack one, a line above the tiles reads Savings cover the N of M requests that have a reference model.Each tile's help explains it. |
| Empty panel | When no request in range has a reference model, Savings breakdown reads No requests with a reference model in this range, and Savings waterfall adds the count of requests without one, which are counted but not charted. |
Savings waterfall | Seven bars: Reference, Routing, Compression, Cache + dedup, Cost, Provider cache (est.), Estimated bill (axis ticks Ref., Routing, Compr., Cache, Cost, Prov., Bill). A dashed line marks the Cost value. Legend: reference (est.), routing, compression, cache + dedup, cost, cost line (list price). Hovering a bar shows its amount. |
Savings breakdown | Savings per bucket by mechanism: Cache + dedup, Compression and Routing stack to Saved (gross); routing below zero means models pricier than the reference were picked. The tooltip adds Saved (net), Cloud Score's optimization overhead and the provider cache-read discount. Dates are UTC. The Bucket switch offers Hour (on 30 days only), Day, Week and Month; the default is Day up to 90 days and Week beyond. |
Breakdown | One row per Model, Team, Provider or Agent, with Requests, Would-have-paid, Actual, Saved (net), Saved (gross), Overhead, Savings %, Top optimization and a per-mechanism Breakdown. Chips narrow the rows by value, provider or top optimization. |
Optimization engine | The tiles Requests optimized (sub of N requests) and Tokens avoided, then the cards below. |
By mechanism | Columns Mechanism | Mode | Applied | Would apply | Saved | Would save | Conf p50. One row per mechanism, with a wiring pill (Observe only or Not wired) beside the name where the backend does not act on it. Mode is a badge auto, observe, or off. Applied adds (N ↓)when some rows cost more than the reference. The server's explanatory note sits under the table. |
Output budget | Rows Caps applied, Observed safety rate, Rollbacks · cost, Added latency p50 / p95. |
Recommendations | One row per recommendation: a confidence badge such as 78%, a bold title, a line joining the subject and the recommended action with a middle dot, and, when estimated, ≈ $/month (est.). Empty: Nothing above threshold in this range. |
Cost / quality guard | Columns Model | Req | Success | Retry | Fallback | Escalation | Failure | $/success, one row per executed model. Empty: No executed requests in range. |
Mechanism rows and what the server note says each figure is built from.
| Mechanism row | Its figures come from |
|---|---|
Exact response cache, Semantic response cache, In-flight dedup | The served entry's measured original cost; for a dedup follower, its leader's measured cost. |
Prompt Optimization | The tokens the compress node removed times the selected model's input price; exact for OpenAI and Azure tokenizers, estimated for every other family. |
Routing vs reference model | Reference minus compression minus cost over executed rows; negative on an escalation. |
Provider prompt cache | Measured cached tokens times the published discount, minus the cache-write premium. |
Output budget | Claims no dollars; it reports caps, a safety rate, and rollbacks in its own card. |
Routing adjustments, Context caching | Mode and confidence only; their count and money columns are structurally absent on this tab. |
What you can do
| Action | What happens | What you see | Confirmation |
|---|---|---|---|
Optimizations / Prompt Optimization | Opens the corresponding page from the Analytics navigation. | The page's content, range control and filters; Back/Forward returns to the previous URL. | no confirmation |
30 days / 90 days / 180 days / 1 year | Changes the Overview range and recomputes the default bucket. | Tiles, Savings breakdown, Breakdown, the mechanism table and Recommendations refetch. | no confirmation |
Any filter chip; Clear filters | Narrows every Overview aggregate to matching requests. | Tiles, charts and tables refetch. | no confirmation |
Hour / Day / Week / Month | Changes the bucket of Savings breakdown. | The chart refetches with one stacked bar per bucket. | no confirmation |
Hover a — in the mechanism table or Output budget card | Nothing changes. | A tooltip beginning Structurally absent, not zero explaining why the figure is unrecorded. | — |
Step-by-step
Read the savings for a range.
Click
OptimizationsunderAnalyticsin the sidebar.The overview opens with
30 daysselected.Pick a range:
90 days,180 daysor1 year.Optionally click
+ Moreand setAPI keyto one key.Read
Saved (net)andActual / Would-have-paid.Would-have-paid is the declared reference model's price at the tokens actually processed; Actual is what was paid, including Cloud Score's optimization overhead. Their difference is Saved (net). See Costs, savings, and estimates for how the reference is chosen.
Follow the
Savings waterfallfromReferencetoEstimated bill.Routing,Compression, andCache + dedupstep the bar down toCost;Provider cache (est.)steps it down again toEstimated bill.Read
By mechanism, then hover any—.AppliedandSavedare measured for the two caches,In-flight dedup,Routing vs reference model,Provider prompt cacheandPrompt Optimization.Would applyandWould saveare always—on this tab except forPrompt Optimization, whose outcome writer records them.
Narrow the view to one team, app, or request status.
Choose the team in the
Teamchip.Application,Agent,Environment,End user, andModelwork the same way; values come from the attribution your application sends.Click
+ More.Set
Statustocompleted,failed, orblocked, orCost statustocomputed,estimated,pending, orreconciled. A chip that is set stays visible.Click
Clear filtersto return to the whole workspace.
Act on a recommendation.
Read the
Recommendationscard onOverview.Each row pairs a confidence badge with a title, then the subject and a recommended action. The four titles the engine can raise are
Top-tier model carrying simple tasks,One request in ten needed a retry or failover,Exact repeats are being re-executed, andCache-eligible traffic rarely hits.Cross-check the model in
Cost / quality guard.Its
Retry,Fallback,Escalation, andFailurerates and$/successtell you whether the recommendation matches what the model actually did.Open
Optimization settingsunderGatewayto change the mechanism the action names.Mechanism modes, confidence floors, and the reference model live there.
Examples
Cost review for one team over 30 days
- What you do
On
Overview, keep30 daysand choosegrowthin theTeamchip.- What Cloud Score does
Recomputes every aggregate on the server over that team's requests in range, comparing each row against its declared reference model.
- What you see
Tiles reading
Saved (net)$18.44andActual / Would-have-paid$42.68 / $61.12, and, underOptimization engine,Requests optimized1,204of 3,410 requests. The waterfall showsRoutingandCache + dedupbars, andBy mechanismlistsExact response cachewithauto,Applied812,Saved$9.15, whileWould applyandWould saveread—.
An unreliable model surfaces in Recommendations
- What you do
Read the
Recommendationscard, then find the same model inCost / quality guard.- What Cloud Score does
Raises a recommendation from the range's retry and failover rates. The router's reliability penalty for the model is recorded separately, on Optimization settings ›
Routing signals.- What you see
A row
78%One request in ten needed a retry or failoverwith the linegpt-4o-mini · Enable routing_adjustments (reliability penalty) so unreliable models are de-prioritised, andCost / quality guardshows that model'sRetryrate.
Reading the numbers
| Label | Meaning | Unit / format | Shows — when |
|---|---|---|---|
| Requests optimized | Requests in range the engine optimized; the sub line gives the total in range. | count, abbreviated above 10,000 (1.2k, 1.2M) | Never; always a number. |
| Tokens avoided | Tokens not sent or billed because of cache, dedup, or compression. | count, abbreviated | Never; always a number. |
| Saved (net) | Saved (gross) minus Cloud Score's own optimization overhead on the same requests; computed on the server. | USD | Unknown while a request in range has an unpriced overhead call or an unpriced reference; the tile names the cause. |
| Saved (gross) | Would-have-paid minus the model spend on the same requests: routing, compression and response cache + dedup, before overhead. | USD | Unknown while a reference request is unpriced; the tile names the cause. |
| Savings waterfall | Reference, minus routing, compression, cache + dedup, to cost; minus provider cache to estimated bill. | USD per bar | The chart is replaced by a note when no request has a reference model, or when savings cannot be compared. |
| Savings breakdown | Cache + dedup, compression and routing savings per bucket, stacking to Saved (gross). | USD, stacked | Reads No requests with a reference model in this range when none has one. |
| Mode | The mechanism's configured mode, merged in from settings. | badge auto, observe, or off | Rows with no mode setting: Provider prompt cache and Routing vs reference model. |
| Applied | Requests the mechanism was applied to; the (N ↓) suffix counts rows where cost went up. | integer | Structurally absent for Output budget, Routing adjustments, and Context caching: no outcome writer has filled that column. |
| Would apply | Observe-mode count of requests the mechanism would have applied to. | integer | Every mechanism except Prompt Optimization: no other mechanism has a recorded column for it. Optimization settings shows would counts instead. |
| Saved | Measured USD the mechanism saved. | USD string | Output budget, Routing adjustments, and Context caching. |
| Would save | Observe-mode estimated USD. | USD string | Every mechanism except Prompt Optimization, for the same reason as Would apply. |
| Conf p50 | Median confidence the mechanism recorded. | two decimals | No confidence recorded in range. |
| Caps applied | Output-budget caps set on requests. | integer | Always; read from the outcomes block that no writer fills yet. |
| Observed safety rate | Share of capped rows that would have been safe. | percent | No safety rate recorded. |
| Rollbacks · cost | Rollback count and the cost those re-runs added. | N · $x | Always; same guard as Caps applied. |
| Added latency p50 / p95 | Latency the engine itself added. | ms, or seconds above 10s | Either half is unrecorded; only that half shows the dash. |
| ≈ $/month (est.) | A recommendation's estimated monthly effect. | USD string | The line is omitted when there is no estimate. |
| $/success | Cost per successfully completed task for that model. | USD string | No successful task recorded for the model. |
Good to know
A dash is a missing measurement, never zero.
Every figure except cost is an estimate, and a figure with no data behind it renders — with a cause in its tooltip. Would apply, Would save, Caps applied, and Rollbacks · cost are always — on Overview; Optimization settings shows would-apply counts per mechanism without that guard, so the two pages disagree by design.
Rows without a reference are counted, not charted.
Only requests with a stored reference cost enter the tiles' savings, the waterfall, and the mechanism table. Rows whose cost is still pending, that had no candidates, that were blocked before matching, or that were recorded before the optimization engine's migration are counted in the empty panel's number and nowhere else. Set a reference model on Optimization settings to start filling the waterfall.
Wiring pills
Observe only beside a mechanism means its decision is recorded and reported but nothing acts on it. Not wired means no backend code reads the field at all. Which mechanisms wear a pill depends on your backend; Context caching is Observe only in every case. Hover the pill for the backend line that proves it.
Filters and states
Loading reads Loading… per card; a failed query shows the server's message in red, or Something went wrong. Response-cache savings need a policy cache mode or a workspace default; see Caching and deduplication.
Related
- Optimization settingsSet the reference model, the workspace-default response cache, and each mechanism's mode and confidence floor, confirm promotions and check a decision before traffic feels it, and read the routing signals.
- Response cacheThe Response cache section on the Settings tab of Optimization settings: how many answers the response cache holds, whether semantic lookups can use the vector index and the embedder, which entries are earning hits, and how to purge by scope.
- ObservabilityThe per-request audit trail and the gateway's health: filter the request list, open a request for its route, attempts, cost and savings receipt, and read latency, outcomes and retries on Gateway health.
- Attribute cost to teams and appsTag every request with team, application, agent, environment, and end_user so Usage & cost can break spend down by them as reported tags, budgets can cap a team or an app, and alert rules can watch them.
- Roll out an optimization safelyPromote one optimization mechanism from observe to auto without surprising your callers: read the would-apply counts, set a confidence floor, confirm the promotion, verify it per request in Observability, read the savings on Optimizations, and roll back in one save.
- Cut Cost Without Losing QualityPrice the cost of quality on one real prompt, write the two policies that pay for themselves, promote an optimization mechanism only when the observe counts justify it, then read the ledgers that prove it worked.