Roll out an optimization safely
Promote one optimization mechanism from observe to auto without surprising your callers: read the would-apply counts, set a confidence floor, confirm the promotion, verify it per request in Observability, read the savings on Optimizations, and roll back in one save.
On this page
Prompt Optimization: optimize, review, then run
Prompt Optimization has one ON/OFF control, defaults ON, and accepts any prompt length. In Playground, Optimize prompt prepares a complete optimized prompt before answer routing, at the level you pick — Standard, Balanced or Thorough. Live counts use a real backend tokenizer. Review the original, optimized version and diff, then choose Run original or Run optimized. Our checks cannot guarantee that meaning is preserved, which is why you review the result. Editing the request invalidates its comparison. Workspace defaults are under Optimization › Settings.
Playground explicitly requests a bounded optimization and shows its recorded cost. A rejected, unavailable or unhelpful result falls back to your original without hiding its expense. Requests sent ON without a prepared proposal are optimized by structural rules only. Comparison details show the outcome, the rules applied and the measured work time. Infrastructure still consumes resources; unallocated compute keeps fully loaded savings unknown. Historical optimization expenses remain recorded and are not reset to zero.
The execution receipt distinguishes the selected prompt from the prompt actually sent for the answer, including no provider send when a cache supplies it. Optimization can have a recorded cost even when the original is selected or no answer is generated. Unknown infrastructure cost keeps fully loaded net unknown. Fewer tokens do not establish a latency or quality improvement. Analytics, ROI and Reports reuse Prompt Optimization evidence with production/demo filters and daily, weekly and monthly views.
See Playground for comparison and recovery, and Analytics for measurement coverage. Historical compression receipts do not establish choices or costs that were never recorded.
The path
Every mechanism climbs the same ladder. Nothing on it changes a request until you move it to auto and confirm.
off
nothing runs; the plan records skip / not_available
observe
the full decision runs and is recorded; nothing is applied
auto
applied only when confidence reaches the mechanism's minimum
Anything new starts in observe.
In-flight dedup, Output budget, Routing adjustments and Context caching ship at observe. The two response caches ship at auto but only act on requests that a policy cache_mode or the Response cache workspace default has opted in. Prompt Optimization has a separate ON/OFF control, defaults ON, and needs no compression policy. Playground comparisons run with a bounded hosted rewrite and require review; ordinary ON requests without a prepared proposal retain deterministic rules. Review changed wording and estimated input savings before adopting a candidate.
Read what observe would do
Why: a mechanism in observe already records what it would have done. Read that record before you let it act, and note the quality baseline you will compare against later.
Click
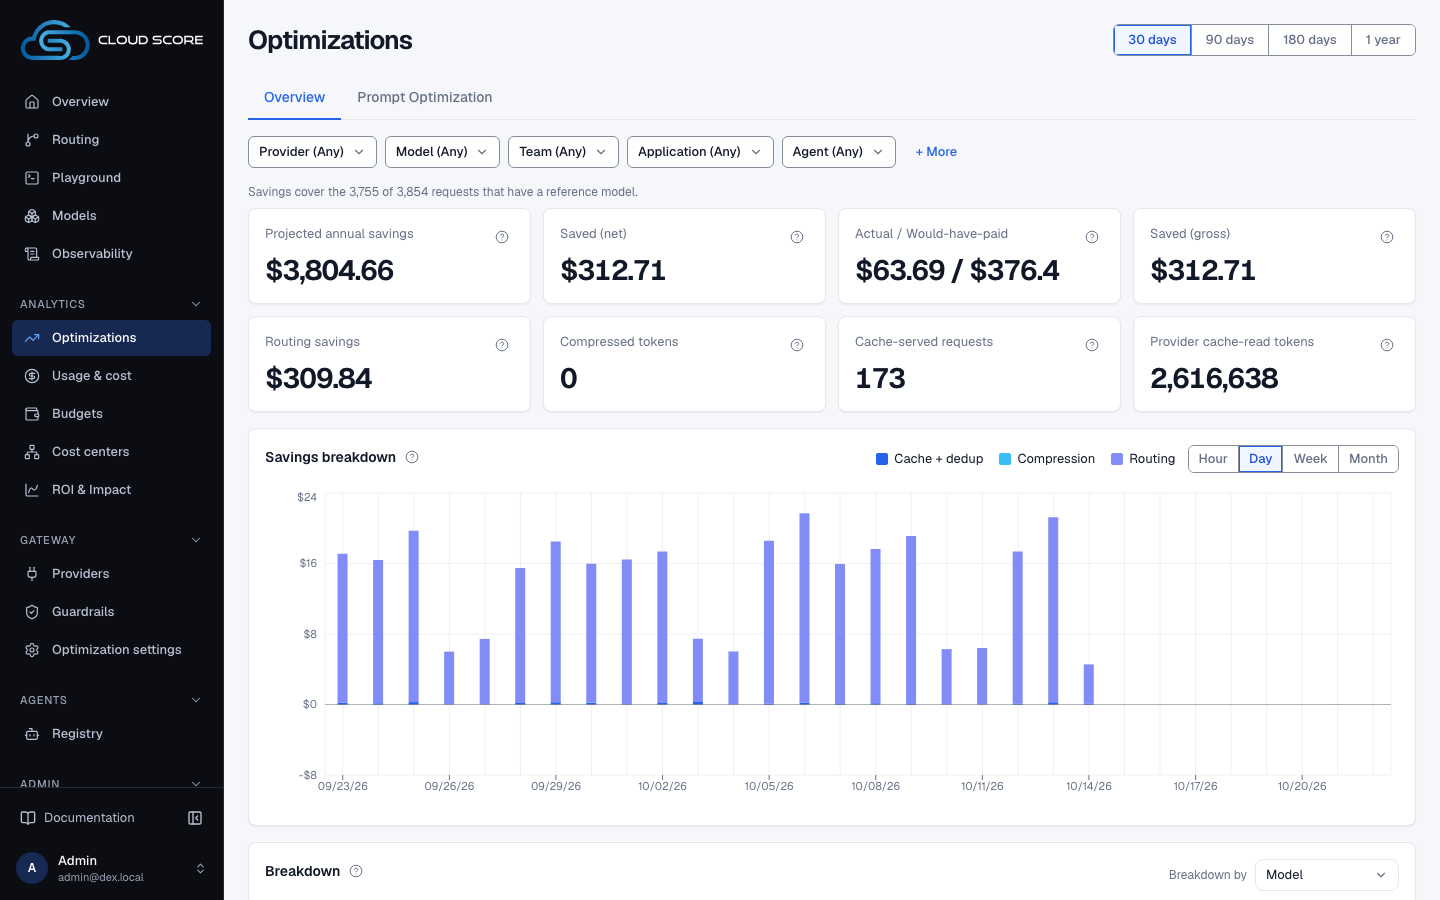
OptimizationsunderAnalyticsin the sidebar and keep30 days.The range (
30 days,90 days,180 daysor1 year) and the filter bar (Provider,Model,Team,API keyand so on) narrow every figure on theOverviewtab.Read
By mechanism.Columns are
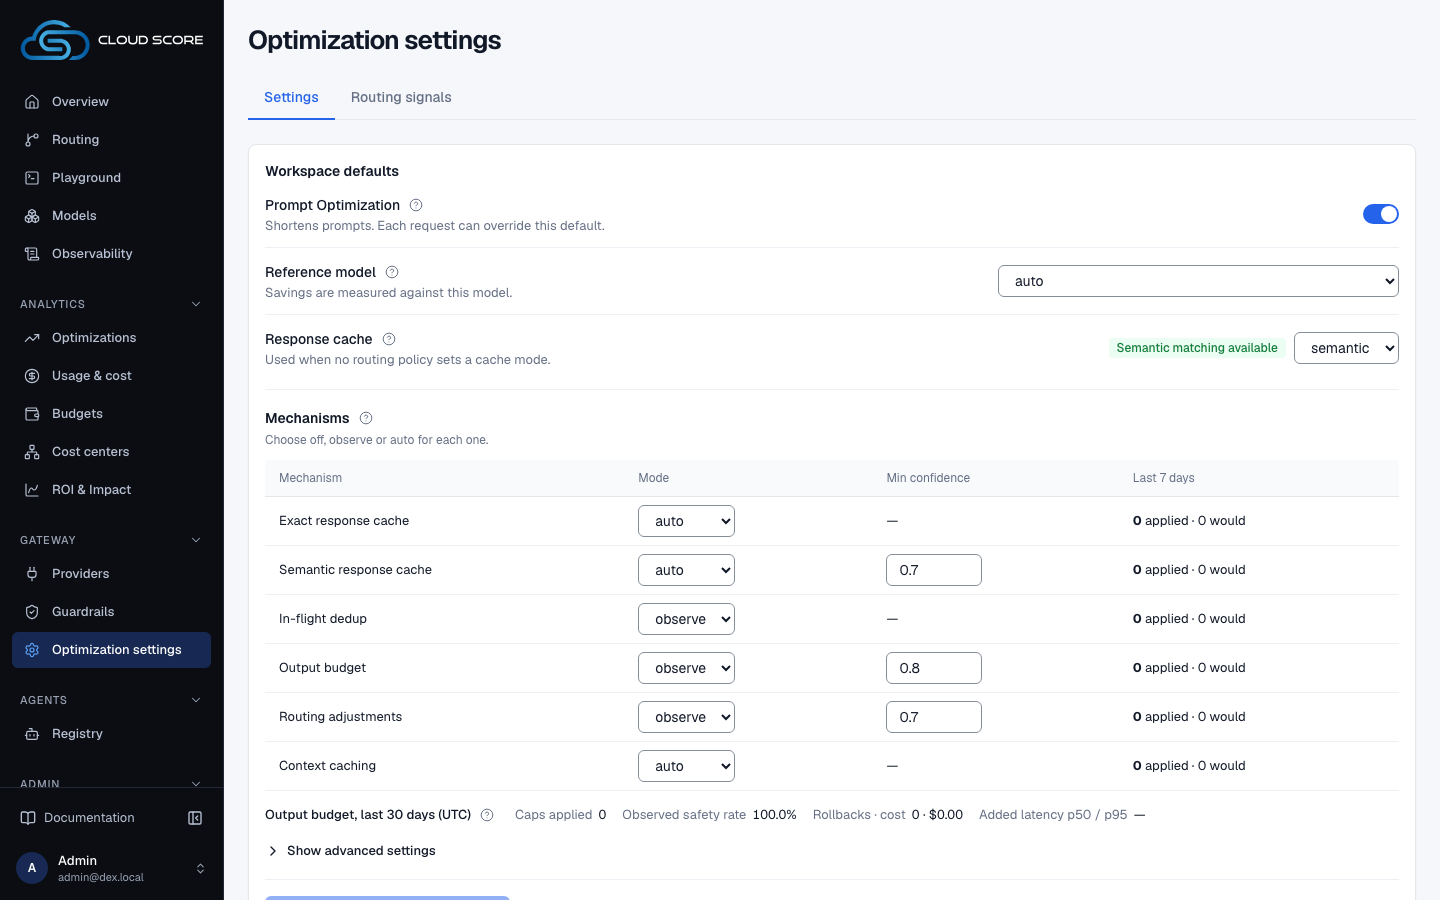
Mechanism,Mode,Applied,Would apply,Saved,Would saveandConf p50. TheModebadge names the current mode.Would applyandWould saveread—here for every mechanism except Prompt Optimization; the per-window observe counts are in Optimization settings.Get the 7-day observe counts from
Settings.The
Settingstab of Optimization settings counts applied and would-apply requests per mechanism in itsLast 7 dayscolumn, described in the next station.Note your quality baseline in
Usage & cost.Switch its
Breakdown bytoModeland write downSuccessand$/completed requestper model. After promotion you wantSuccessunchanged and$/completed requestlower. Gateway health'sRequest outcomesandRetries & fallbacksgive the same baseline over time.Read
Recommendationsand theOutput budgetline.Recommendationson Optimizations names what a change could still save, with an estimated monthly effect that is never added to savings. TheOutput budget, last 30 days (UTC)line, under the mechanism table in Optimization settings, showsCaps applied,Observed safety rate,Rollbacks · costandAdded latency p50 / p95.
Without reference-priced traffic, the Savings waterfall reads No requests with a reference model in this range. Set one under Optimization settings › Reference model first; see Costs, savings, and estimates.
Promote one mechanism
Why: promote one mechanism per save. The confirm dialog then names exactly one change, and every difference you see afterwards in Observability and on Optimizations has one cause.
Open
Optimization settingsunderGateway; theSettingstab opens first.The mechanism table has columns
Mechanism,Mode,Min confidence,Last 7 days, with one row per mechanism.Read the row's
Last 7 dayscell.It reads
{applied} applied · {would_apply} would; hover it forsaved {fmtUsd} · would save {fmtUsd}. A row with0 applied · 96 wouldhas enough evidence to act on; a cell that reads—has no rows yet, so keep observing.Check the wiring badge beside the label.
No badge means the control is live.
Observe onlymeans you can setautoand save, but no request changes because of it yet.Not wiredmeans the control is disabled and the value is stored but ignored. Hover either badge for the backend line behind it.Set
Min confidencefor the row.A number input that accepts 0.5 to 1 in steps of 0.05, present only for
Semantic response cache,Output budgetandRouting adjustments(the others show—). Inauto, a decision below this bar behaves as observe and records the reasonlow_confidence, so start at the default and lower it only if almost every request readsskipped · low confidence.Change the row's
Modeselect fromobservetoauto.Leave every other row as it is. For
In-flight deduporOutput budgetthe bannerAuto dedup and output budgets change what clients receive.appears at once, with the consequence:Coalesced followers stream nothing until the leader settles; a capped call that truncates bills one rollback attempt.Click
Save optimization settings.Because a mechanism moves to
auto, the dialogStart applying these mechanisms automatically?opens. Its body names the promoted mechanism and warns that clients may receive cached or coalesced answers, a smaller output budget, or a different model.Click
Save and apply.The button reads
Working…, then the table shows the saved mode and theModebadge in By mechanism on Optimizations readsauto.Cancelkeeps your draft unsaved. A failed save shows the server message orSave failed.Optional: try one request with
Check a decision.Open it at the foot of the tab, paste an OpenAI-style body in the textarea and click
Check decision. The plan grid showsReferenceas{reference.model_key} ({reference.source})and one cell per mechanism as{mode} · {decision} · {reason}. It runs the decision node only: no policy, no provider call, nothing stored.
| Mechanism | Default min confidence | In auto, the caller may get |
|---|---|---|
In-flight dedup | none (no threshold) | an in-flight leader's answer; followers stream nothing until the leader settles and bill zero |
Output budget | 0.8 | a predicted max_tokens cap; a call that truncates is re-run once and bills one rollback attempt |
Routing adjustments | 0.7 | a different model when measured health, reliability, or latency penalties shade a near-tie |
Semantic response cache | 0.7 (a floor; a policy's similarity bar can raise it, never lower it) | a stored answer for a paraphrase above the similarity bar |
Exact response cache | none (no threshold) | the stored answer for a repeated prompt |
Context caching | none (no threshold) | nothing yet: badged Observe only |
Prompt Optimization uses a separate review flow
It does not use the mode or confidence controls in this table. Optimize prompt in Playground, review the original, optimized prompt and diff, then choose a version. Explicit Playground optimization requests a bounded hosted rewrite with recorded API expense. Historical paid optimizer expenses stay visible in their original records, while current local compute remains an infrastructure cost. Requests without a reviewed proposal retain the deterministic engine.
Context caching is observe-only today.
Context caching wears the Observe only badge on every backend. Setting it to auto saves but changes no request. What actually attaches a provider prompt-cache breakpoint is the checkbox Legacy Anthropic prompt-cache hint (pre-engine baseline) under Show advanced settings.
The two response caches are the exception to the ladder.
They default to auto, and turning the Response cache workspace default from off to exact or semantic asks first with Turn the response cache on for this workspace?. The help beside Mechanisms says of their observe setting that it arrives with the caches sub-project (until then it behaves as auto). Roll a cache out per policy instead; see Response cache.
Verify it per request in Observability
Why: aggregates lag and blend. One request in Observability tells you whether the promoted mechanism applied, skipped, or fell below its floor on real traffic.
Open
Observabilityfrom the sidebar and a recentcompletedrow.Narrow with the
API keychip if you promoted for one team's traffic. TheRequestdrawer opens.Read the
Optimizestation on the route board.Its summary counts modes in the plan, for example
1 auto · 4 observe. After your save theautocount should have risen by one.Find the mechanism's row in
Optimization decision.Seven rows, one per mechanism. Each shows the mode badge (
autogreen,observeamber,offgrey), the decision word when it is notskip, a state badge, and the confidence as a percentage when above zero.Read the state badge.
Use the table below. A row that says
observedid not change the request; it only recorded what it would have done.Read the ledger at the bottom of the card.
An executed request shows
Reference cost (est.),− Routing (est.),− Compression (est.),= Cost. A served request (cache hit or dedup follower) shows a singleServed · saved (est.)line. The footer readsengine added {n} ms.View full requestopens the request page, whoseSavings receiptsplits the saving by mechanism.
| Badge | Meaning | What to do |
|---|---|---|
applied | the mechanism changed this request | compare cost and quality against your baseline |
skipped · low confidence | mode was auto but confidence fell below Min confidence, so it behaved as observe | expected on some rows; if it is every row, the floor is above what the mechanism ever reaches |
skipped | the outcome writer ran and the mechanism did not apply; hover for the reason | nothing, unless the reason surprises you |
— | unrecorded: the row predates the outcome writer | do not read it as skipped; pick a newer row |
In the list, Gateway status and Retry / fallback evidencesummarize each row; the drawer's Cache section shows whether a cache or a dedup leader served it. To dig into one request further, follow Investigate a request.
Output budget promoted with the floor at 0.8
- What you do
On
Settings, setOutput budgettoautowithMin confidence0.8, confirmSave and apply, then open two later requests inObservability.- What Cloud Score does
Predicts a cap for each request. Where its confidence reaches 0.8 it caps the call; where it does not, it records the decision and leaves the call untouched.
- What you see
In the first drawer, the
Output budgetrow readsauto,appliedand a confidence such as91%. In the second it readsautoandskipped · low confidence. Both requests still showcompleted.
Read the savings
Why: Optimizationssplits the savings by mechanism over your range and filters, so the promoted mechanism's share grows once traffic has run through it.
Click
OptimizationsunderAnalyticsin the sidebar and keep30 days.Apply the same filter you used in Observability, for example the
API keychip set to one key, so the figures match the traffic you promoted.Read the
Savings waterfall.Routing,CompressionandCache + dedupstep theReferencedown toCost. TheProvider cache (est.)step that follows is never Cloud Score savings.Read the promoted mechanism's row in
By mechanism.Appliedclimbs, andSavedfills where the mechanism records a dollar estimate. Prompt optimization has its own tab,Prompt Optimization.Read
Recommendations.A promotion that works removes the recommendation it addresses. Their monthly figures stay estimates and are never added to savings.
Output budget claims no dollars.
Output budget and Context caching carry no dollar estimate: in By mechanism their Saved reads — with its cause. Judge output budget on the Output budget, last 30 days (UTC) line and on Success and $/completed requestin Usage & cost, not on a savings line.
Roll back
Why: a downgrade needs no confirmation. Rolling back is one select and one save.
Open
Optimization settings›Settings.Set the row's
Modeback toobserve.Choose
offonly if you also want to stop recording;observekeeps the would-apply counts growing so you can try again with a higherMin confidence. LeaveMin confidenceand the advanced fields as they are; the mode alone decides whether anything is applied.Click
Save optimization settings.No dialog: only a promotion to
autoor a cache default going on asks first. The button readsSaving…, then the table showsobserveand theModebadge in By mechanism on Optimizations readsobserve.If you rolled a cache out, set the
Response cacheworkspace default back tooff.Entries already stored stay in the store. To clear them, use the
Purgerow of the Response cache section on the same tab withOne API keyorOne modeland confirmPurge cache entries?. A caller can also opt any single request out withconstraints.cache = "no-store"or theX-Dex-Cache-Controlheader, no admin needed.
| Rollback | Where | What it means |
|---|---|---|
| Setting rollback | Settings mode select | Move a mechanism from auto to observe or off. Saves immediately. Requests already recorded keep the plan they ran with; nothing in Observability is rewritten. |
| Output budget rollback | Settings › Output budget, last 30 days (UTC) line | Per request, in auto: a capped call that truncates is re-run once, and that re-run bills one rollback attempt. Rollbacks · cost counts them once the backend records them; until then it reads —. Observed safety rate shows the share of capped rows that would have been safe. |
Purge · Everything cold-starts every client.
The Everything scope removes every entry in the workspace and asks Purge every cache entry? before its red Purge everything button. The Purge help says it plainly: Nothing here is reversible. Prefer Expired entries, One API key or One model.
What to check afterwards
| Where | Look at | What tells you it worked |
|---|---|---|
Observability | a fresh row's Optimization decision card | the promoted row reads auto with applied on most requests and skipped · low confidence on the rest; Status stays completed |
Observability | the Optimize station | the auto count in {n} auto · {n} observe rose by one |
Optimization settings | Settings › Last 7 days cells | the applied half of {applied} applied · {would_apply} would starts climbing |
Usage & cost | Breakdown by Model | Success matches your baseline; $/completed request is lower |
Optimizations | By mechanism | the row's Mode badge reads auto; Applied and Saved fill where the mechanism records them |
Optimizations | Savings waterfall and Recommendations | the mechanism's step grows and the recommendation it addresses goes away |
Gateway health | Request outcomes and Retries & fallbacks | failed and retried requests stay at your baseline |
Give each promotion a full 7d before the next one, then repeat from Read what observe would do for the next mechanism. For the wider cost programme, see Cut cost without losing quality.
Related
- Statuses and badgesEvery status word and badge Cloud Score shows, what each one means, and the page it appears on.
- GlossaryEvery Cloud Score term that appears in the app, what it means in one or two sentences, and the page and tab where you meet it.
- TroubleshootingThe messages Cloud Score puts in front of you, grouped by the page that shows them, with what caused each one and what to do next.
- OptimizationsRead what the optimization engine applied and what it saved against the reference model, on the Optimizations and Prompt Optimization pages in Analytics.
- Optimization settingsSet the reference model, the workspace-default response cache, and each mechanism's mode and confidence floor, confirm promotions and check a decision before traffic feels it, and read the routing signals.
- ObservabilityThe per-request audit trail and the gateway's health: filter the request list, open a request for its route, attempts, cost and savings receipt, and read latency, outcomes and retries on Gateway health.