Usage & cost
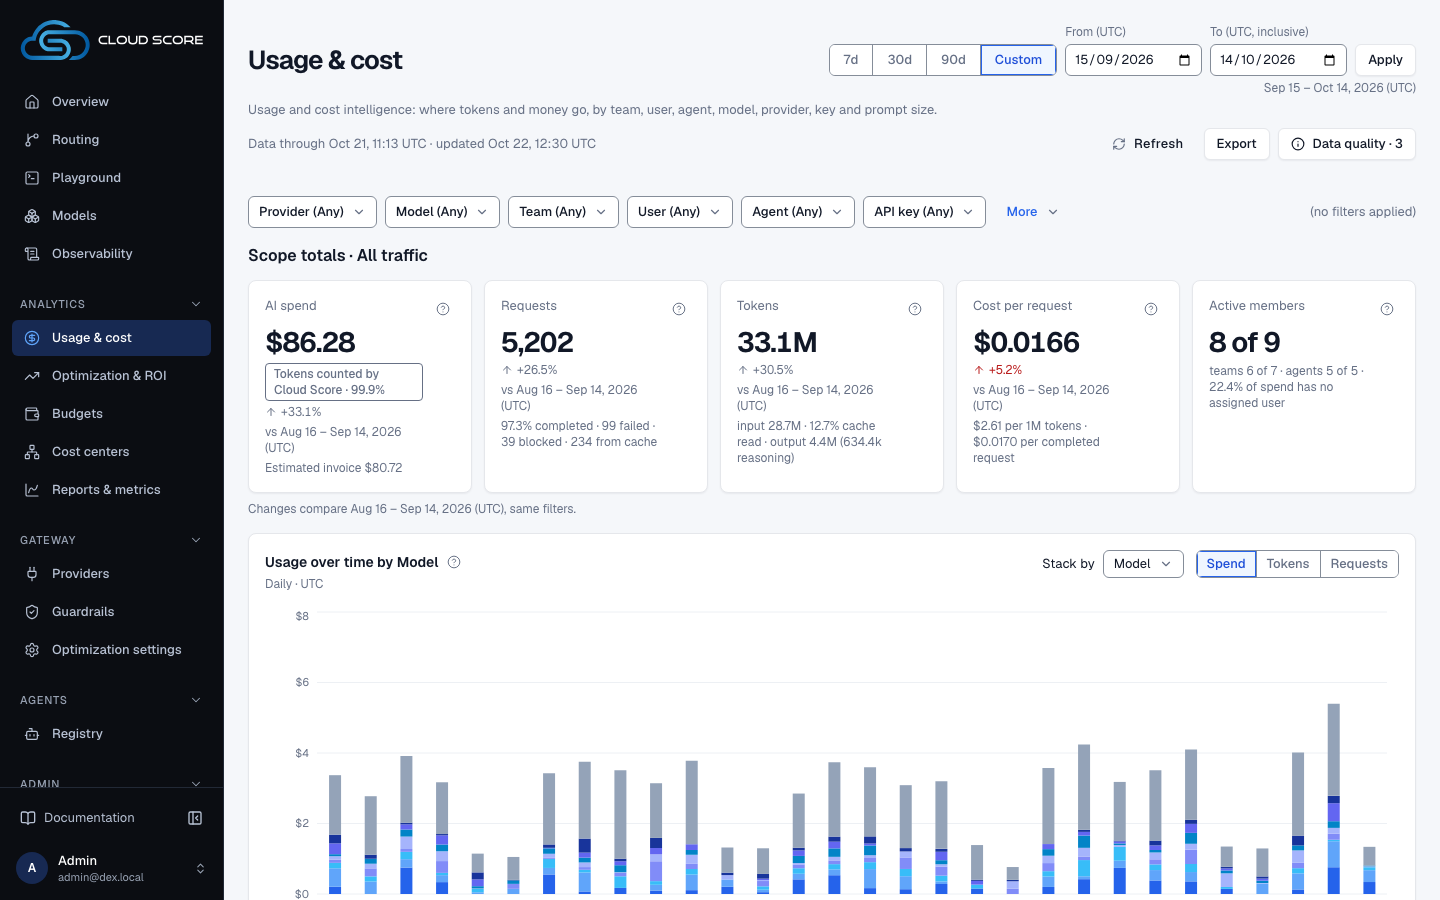
Where tokens and money go, by team, user, agent, model, provider, key and prompt size: five scope tiles, usage over time, token composition, share of requests against share of spend, and one breakdown table with a drawer per row.
On this page
Prompt Optimization: optimize, review, then run
Prompt Optimization has one ON/OFF control, defaults ON, and accepts any prompt length. In Playground, Optimize prompt prepares a complete optimized prompt before answer routing, at the level you pick — Standard, Balanced or Thorough. Live counts use a real backend tokenizer. Review the original, optimized version and diff, then choose Run original or Run optimized. Our checks cannot guarantee that meaning is preserved, which is why you review the result. Editing the request invalidates its comparison. Workspace defaults are under Optimization › Settings.
Playground explicitly requests a bounded optimization and shows its recorded cost. A rejected, unavailable or unhelpful result falls back to your original without hiding its expense. Requests sent ON without a prepared proposal are optimized by structural rules only. Comparison details show the outcome, the rules applied and the measured work time. Infrastructure still consumes resources; unallocated compute keeps fully loaded savings unknown. Historical optimization expenses remain recorded and are not reset to zero.
The execution receipt distinguishes the selected prompt from the prompt actually sent for the answer, including no provider send when a cache supplies it. Optimization can have a recorded cost even when the original is selected or no answer is generated. Unknown infrastructure cost keeps fully loaded net unknown. Fewer tokens do not establish a latency or quality improvement. Analytics, ROI and Reports reuse Prompt Optimization evidence with production/demo filters and daily, weekly and monthly views.
See Playground for comparison and recovery, and Analytics for measurement coverage. Historical compression receipts do not establish choices or costs that were never recorded.
What you see
Usage & cost is under Analytics in the sidebar. It answers where tokens and money go, for the whole organization or for the slice the filters select. One range and one filter bar govern every block on the page, and every figure is computed on the server from recorded requests.
| Block | What it shows |
|---|---|
Scope totals | Five tiles under a heading that names the scope: Scope totals · All traffic, or the active filter. AI spend at list price with Estimated invoice beneath it, Requests, Tokens, Cost per request and Active members. The first four compare themselves with the previous period of the same length, and each tile opens the block or column behind it. |
Usage over time by Model | Stacked bars per UTC day (per week above 92 days) for the top eight groups by AI spend, then Other. Stack by switches between Model, Provider, Team, User, Agent and API key; Measure switches between Spend, Tokens and Requests. Click a segment to filter to that group, or a column to narrow the range to that day or week. |
Token composition | Each day's tokens in exclusive buckets: Uncached input, Cache read, Cache write and Output (reasoning sits inside output). The summary line beneath names the Provider cache discount, which lowers the invoice and is never Cloud Score savings. |
Share of requests vs share of spend | Each model's (or, with Group byset to Provider, each provider's) share of requests beside its share of AI spend on one percentage scale, so a model whose cost share far exceeds its usage share stands out. The top eight, then Other; requests with no model sit below the divider. |
Breakdown by | One table with a dimension switch, and a drawer for each row. See The breakdown and its drawer. |
Range, filters and export
Choose 7d, 30d or 90d, or a custom range; 30d is the default. Ranges are whole UTC days ending on the last complete day, so today is never included, and span at most 366 days. The header shows when the data runs through, a refresh button, Export (CSV or JSON of the breakdown, or Print) and the Data quality chip.
The filter bar always shows Provider, Model, Team, User, Agent and API key. More adds Reported application, Reported environment, Reported end user, Status, Task type and Endpoint; Admins also see Include demo traffic. An active filter always stays visible, and Clear filters removes them all. A filter that an old link carries but this page cannot apply appears in an Ignored filters notice instead of being dropped silently.
The breakdown and its drawer
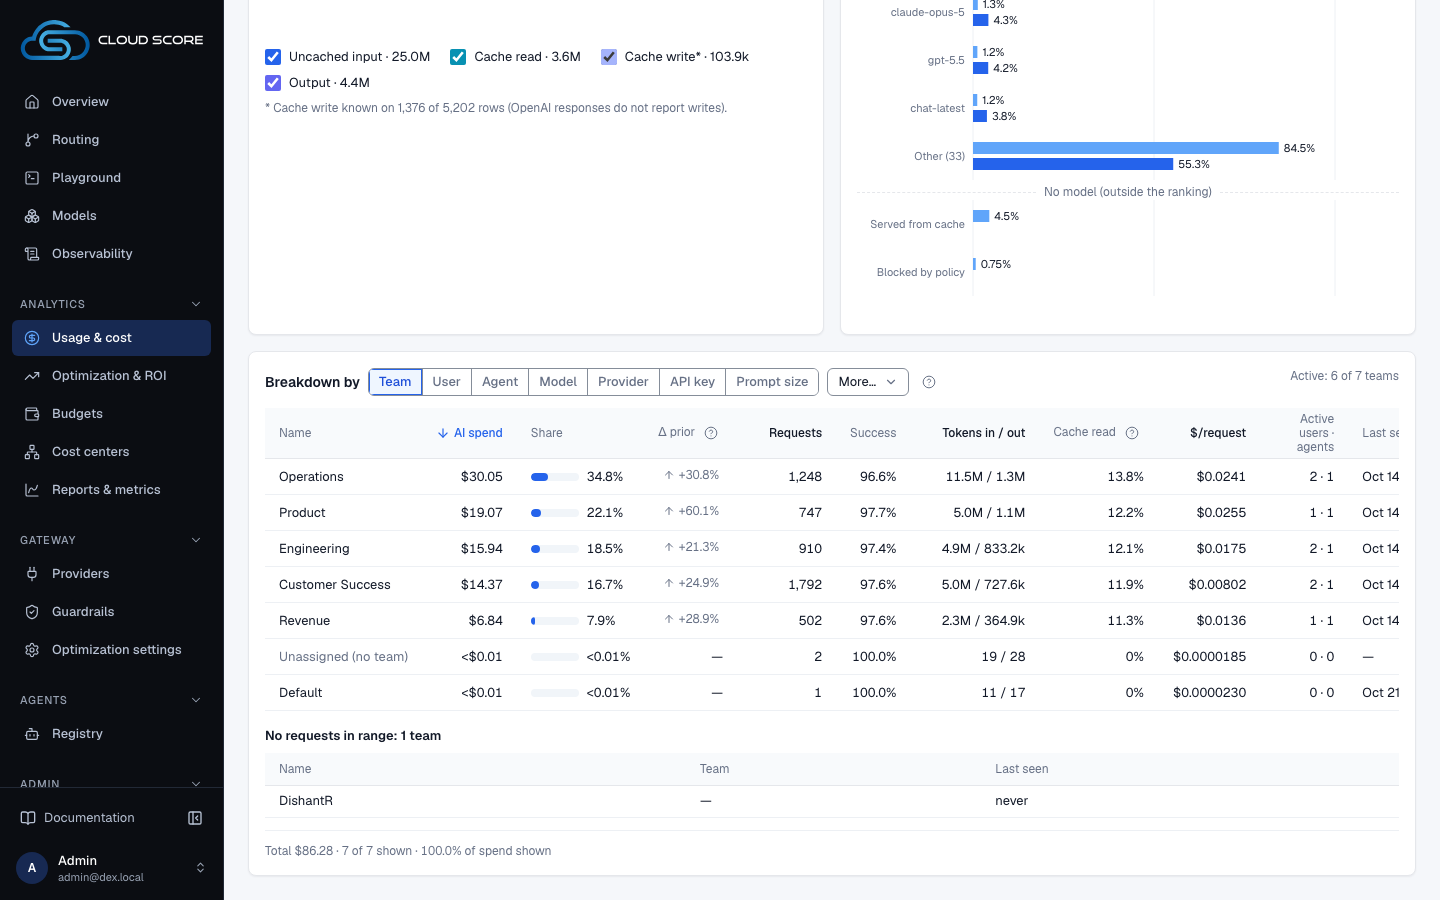
Breakdown by switches between Team (the default), User, Agent, Model, Provider, API key and Prompt size; More adds Reported application, Reported environment and Reported end user. Every dimension shows Name, AI spend, Share, Δ prior, Requests, Success, Tokens in / out, Cache read and $/request; teams, users, agents and API keys add Budget.
| Dimension | Extra columns |
|---|---|
Model | Provider, List price in / out per 1M, $/completed request, p95 latency |
Team | Active users · agents, Last seen |
User, Agent | Team, Last seen |
API key | Last seen |
Prompt size | Compressed, Optimized sends |
Rows rank by AI spend. Other and the unassigned row, such as Unassigned (no team) or Not reported, sit after the ranking so the totals reconcile. On Model and Provider, No model (outside the ranking) holds the requests served from cache or blocked by policy.
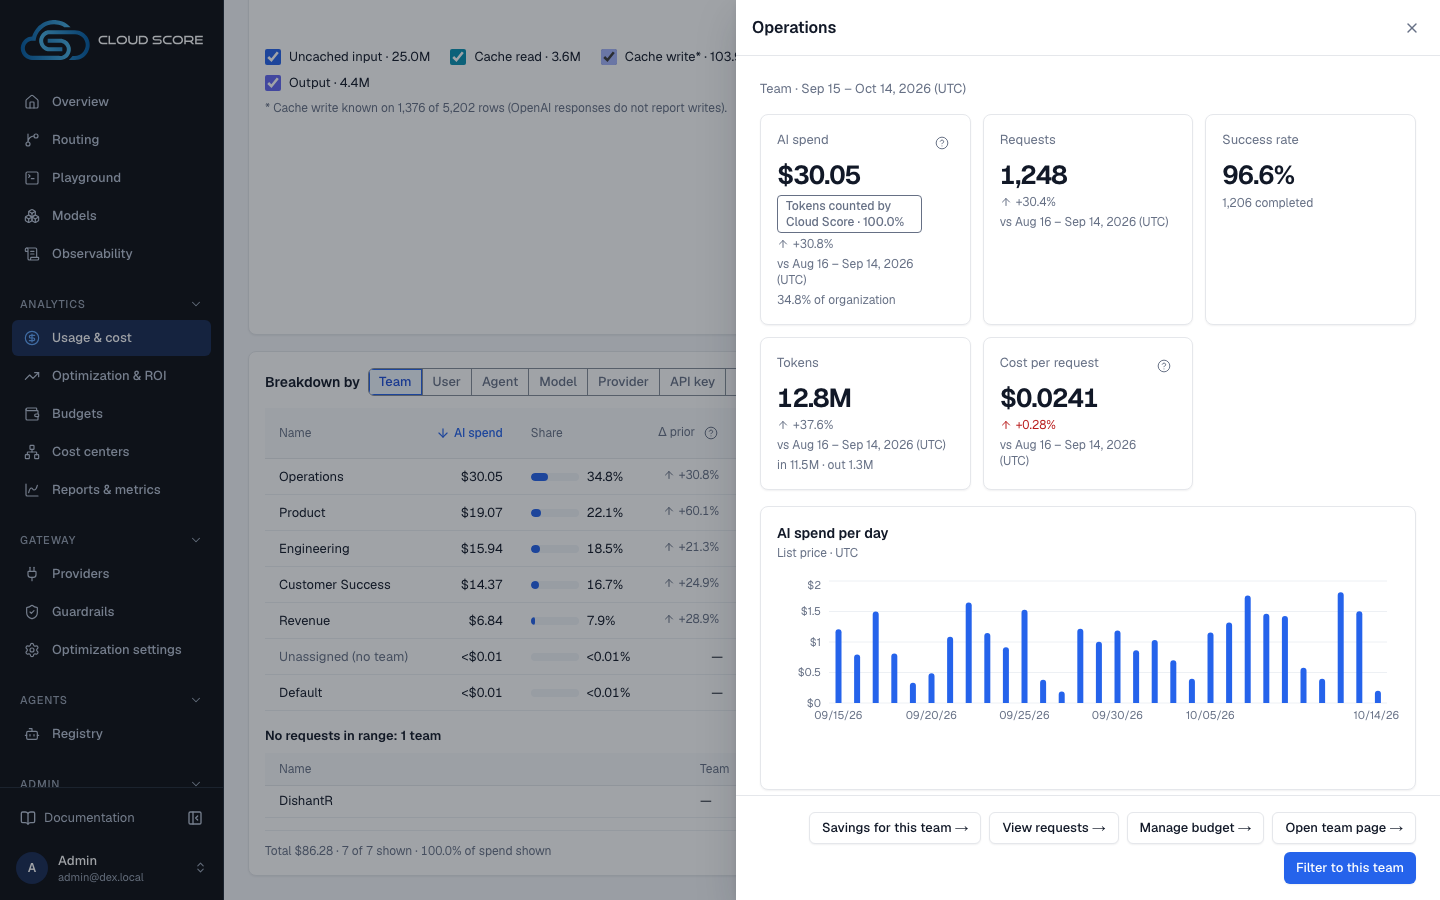
Open a row for its drawer. It names the dimension and range, then shows AI spend, Requests, Success rate, Tokens and Cost per request, AI spend over time, a Break down by table and its Budget card. Its footer offers Savings for this team → (Optimizations with the same filter; agent, model and reported-tag rows open it unfiltered), View requests → (Observability), Manage budget →, Open team page → for Admins or Open agent page →, and Filter to this team, which applies the row as a page filter. The open drawer is part of the address, so a shared link reopens it.
Step-by-step
Find who drove last month's spend, down to one request.
Click
Usage & costunderAnalyticsin the sidebar.The page opens on
30d. ReadAI spendand its change against the previous 30 days.In
Breakdown by, keepTeamand sort byAI spend.Open the top team's row.
The drawer shows that team's totals and trend. Switch its
Break down bytable to Model to see which models it used.Choose
View requests →.Observability opens with the same range and the team filter. Open a request for its recorded route, cost and savings receipt.
Check whether one model costs more than its share of traffic.
Read
Share of requests vs share of spend.A model whose spend bar is far longer than its request bar is the one to look at first.
Click its bar.
The page filters to that model, and every block and the breakdown follow.
Switch
Breakdown bytoPrompt size.Large prompts are where compression and prompt optimization have the most to work with; see Optimizations for what they saved.
Reading the numbers
Money arrives from the server as a string and is never summed in the browser. — means not recorded, never zero, and a partial chip marks a figure computed from the priced requests alone. The concepts behind these figures are in Costs, savings, and estimates.
| Label | Meaning | Unit / format | Shows — when |
|---|---|---|---|
AI spend | What the requests cost at each model's catalog list price on the day they ran. | USD | No priced request in scope. |
Estimated invoice | AI spend less the provider's prompt-cache discount, plus cache-write premiums, from the same price cards. It is not reconciled to a provider bill. | USD | No priced request in scope. |
Requests | Every request in scope. Completed includes requests served from the response cache; Failed reached a provider and returned an error; Blocked is a policy outcome, not a failure. | count | Never. |
Tokens | Input plus output tokens. Cache read is the share of input the provider read from its prompt cache; reasoning tokens are part of output. | tokens | Never. |
Cost per request | AI spend divided by the requests that carry a price, whatever their outcome. | USD | No priced request in scope. |
Active members | Members, teams and agents with at least one request in the range, out of the organization's active roster. With filters set, the active counts follow the filters and the totals stay organization-wide. | count of total | Never. |
Δ prior | Change in AI spend against the previous period of the same length, with the same filters. A change marked partial compares priced requests only. | signed % | No previous period to compare. |
Share / Success / Cache read | The row's share of AI spend, the share of its requests that completed, and the share of its input read from the provider's prompt cache. | % | No priced requests, no requests, or no input tokens. |
Budget | The row's most-used budget, measured over the budget's own period rather than the page range. Every budget for the row is in its tooltip. | USD and % | No budget for the row; users have no member budget. |
Good to know
Teams, users and agents are assignments, not tags.
Team and User come from the API key's assigned team and member when the request was admitted, and Agent from a registered agent. What the caller sent appears as reported tags, such as Reported application, read literally. See Attribution.
There is no project dimension.
Cloud Score has no project entity. Use API key, team or reported application instead.
Old links still open the right view.
Links to the former usage tabs open the matching dimension, and a request link of the form /usage?request= with a request id opens that request in Observability.
Savings live on Optimizations.
This page reports what the traffic cost. What routing, the response cache and compression saved against the reference model is on Optimizations, and the organization budget's pace is on Budgets (Daily Spend vs Even-burn Pace).
Related
- BudgetsCap monthly model spend for the workspace, an API key, a team, an application, an agent, or an environment, and choose whether each budget warns or blocks at 100 %.
- OptimizationsRead what the optimization engine applied and what it saved against the reference model, on the Optimizations and Prompt Optimization pages in Analytics.
- ObservabilityThe per-request audit trail and the gateway's health: filter the request list, open a request for its route, attempts, cost and savings receipt, and read latency, outcomes and retries on Gateway health.
- Home dashboardsA recorded view of request outcomes, estimated cost avoided, routing, optimization, policy attribution, and operational health for the traffic you select.
- Attribute cost to teams and appsTag every request with team, application, agent, environment, and end_user so Usage & cost can break spend down by them as reported tags, budgets can cap a team or an app, and alert rules can watch them.
- Costs, savings, and estimatesWhat AI spend, the estimated invoice, Cloud Score overhead, and the pre-flight estimate each measure, and how one savings ledger reads the same on every page.